
Published 4/4/2025
Context: Statewide End of CCA Programs
Community Choice Aggregation (CCA) programs, once promoted as a mechanism for expanding clean energy and consumer choice in New York, have now ceased operating statewide, according to the New York State Public Service Commission.
At their peak, CCA programs served hundreds of thousands of customers through municipally managed electricity supply arrangements. However, regulatory filings and Commission orders in recent years identified a range of concerns, including limited demonstrated customer savings, recurring billing and enrollment issues, and questions about overall program benefits.
By late 2025, the final municipal electric CCA programs in New York—including Westchester Power and Joule Community Power—had shut down following a combination of regulatory pressure, compliance challenges, and contract expirations.
The statewide cessation did not occur through a single formal prohibition, but rather through a series of filings, compliance actions, and program terminations at the local level.
This report examines the final three years of Westchester Power—the largest and most prominent CCA program in New York—to assess how participation and electricity load changed during the program’s final phase.
Executive Summary
This report analyzes quarterly customer participation and electricity load data reported by Sustainable Westchester to the New York State Public Service Commission (PSC) for performance years 2023, 2024, and 2025.
The available filings provide a complete quarterly dataset for the program’s final three years, allowing direct comparison of customer participation and load over time. However, Q4 2025 reflects a partial quarter due to the termination of Westchester Power on Nov. 30, 2025. For comparative purposes, an estimated full-quarter load is presented alongside reported values, though actual reported data are used as the primary basis for analysis.
More broadly, these data must be interpreted with caution. The PSC has raised concerns regarding Westchester Power’s compliance, including the late filing of the 2025 annual report, failure to timely request an extension, and a material error in the reported filing date. The reported data are further complicated by filing and labeling errors in the 2024 annual report, including late submission and incorrect year labels within the annual dashboard table. The presence of such errors in filings submitted to the PSC, without subsequent correction, raises questions about the extent to which submitted reports are reviewed for accuracy and completeness. While this report analyzes the data as submitted to the PSC, these issues weigh against treating Sustainable Westchester’s reporting as inherently reliable.
Within those limitations, the reported data show a clear pattern:
- Customer participation remained relatively stable through 2024, peaking at 144,236 accounts in Q2 2024
- A sharp contraction occurred between Q4 2024 and Q1 2025, with participation declining by more than 20,000 accounts in a single quarter
- Total participation declined to 117,726 customers by the end of 2025, a reduction of approximately 18% from peak levels
Electricity load followed a different trajectory:
- Quarterly load varied due to seasonal and weather-driven demand, ranging from a high of 333.5 million kWh in Q3 2023 to a low of 170.8 million kWh in Q2 2025
- When adjusted for seasonality and the partial nature of Q4 2025, load remained within historical ranges despite declining participation
This divergence between declining customer counts and comparatively stable load indicates that the program continued to serve a substantial share of electricity demand even as enrollment contracted.
Municipal participation also declined prior to program termination, with multiple communities opting not to renew participation ahead of the final contract cycle.
Taken together, the data indicate that Westchester Power did not experience a sudden collapse, but rather a multi-stage contraction characterized by:
- early customer attrition
- a sharp participation decline entering 2025
- municipal withdrawals
- and eventual program termination at the end of November 2025
Taken together, the data suggest that Westchester Power’s decline was driven less by reduced electricity demand and more by erosion in participation, governance instability, and municipal disengagement.
Methodology and Data Considerations

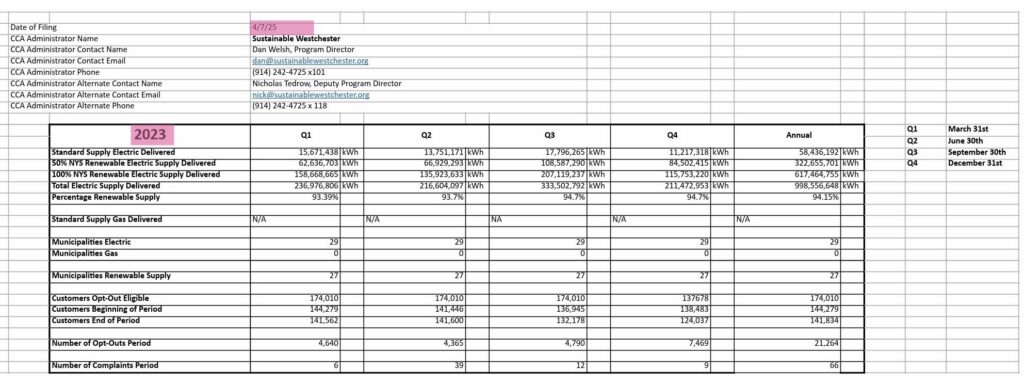
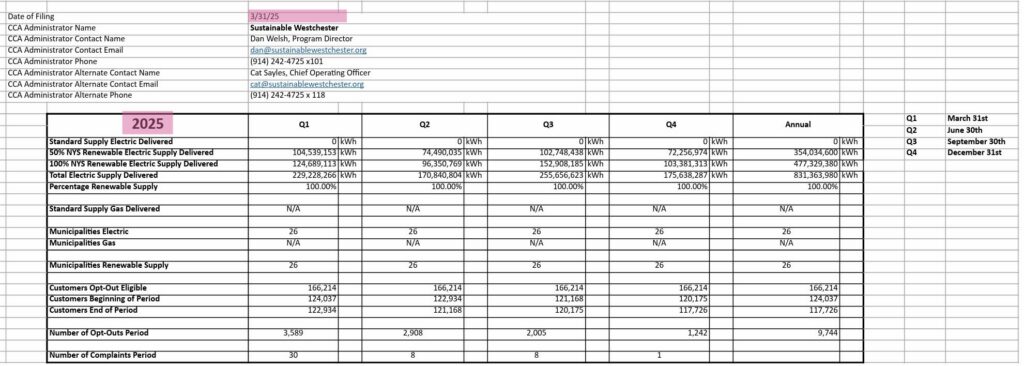
This analysis is based on annual Community Choice Aggregation (CCA) administrator filings submitted by Sustainable Westchester to the New York State Public Service Commission (PSC), covering performance years 2023, 2024, and 2025.
Each filing includes quarterly “dashboard” data reporting customer participation and total electric supply (kWh), enabling direct comparison across the program’s final three years.
The break in contract continuity in 2022 limits longitudinal comparisons with earlier years. Following that disruption, participation levels reflect re-enrollment dynamics rather than a continuation of prior program conditions. As a result, this analysis focuses on the 2023–2025 period, where reporting is more consistent and comparable.
Quarterly electricity load varies due to seasonal factors, including weather-driven demand such as summer cooling and winter heating. As a result, quarter-to-quarter load fluctuations reflect both underlying program participation and normal seasonal variation, and should not be interpreted as solely indicative of changes in enrollment or program performance. Over the period analyzed, quarterly load ranged from a high of 333.5 million kWh in Q3 2023 to a low of 170.8 million kWh in Q2 2025.
Q4 2025 reflects a partial quarter due to the termination of Westchester Power on Nov. 30, 2025. For comparative purposes, a normalized estimate of full-quarter load is included alongside reported values; however, actual reported data are presented and used as the primary basis for analysis.
As noted above, multiple filing irregularities affect the reliability of the reported data; however, for consistency, this analysis uses values as submitted to the PSC.
Specifically:
- The 2025 filing lists a filing date of March 31, 2025, despite being submitted on April 3, 2026 — a material misstatement of the record
- The filing identified as the 2024 annual report, filed July 4, 2025, contains a material internal labeling error: the dashboard table is labeled “2023” despite containing 2024 quarterly performance data
The presence of such errors in filings submitted to the PSC, without subsequent correction, raises questions about the extent to which submitted reports are reviewed for accuracy and completeness.
Quarterly Customers and Load (2023–2025)
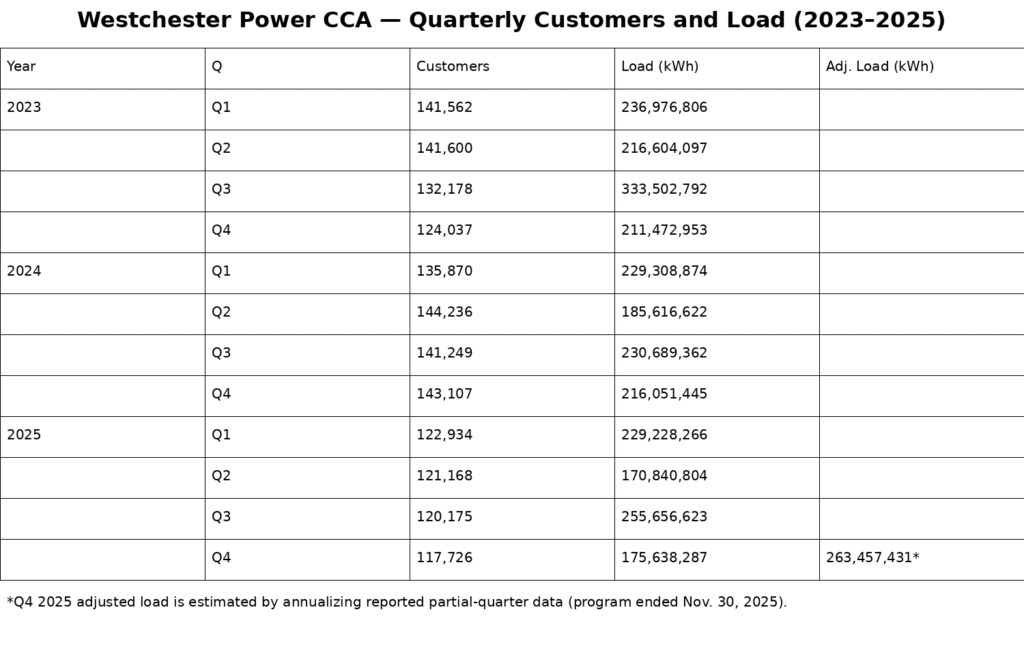
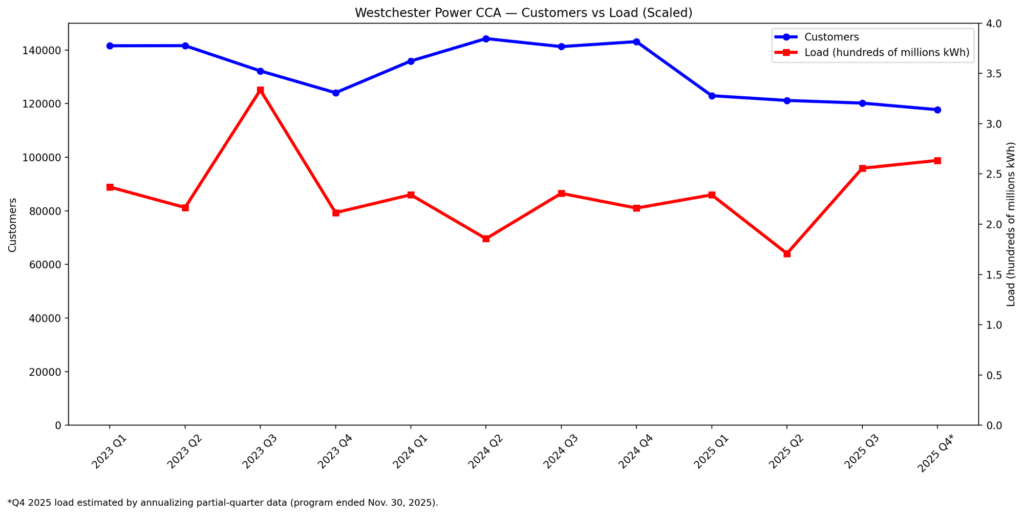
Customers and load are shown on separate axes in the accompanying chart and should not be interpreted as directly proportional.
Note on Q4 2025 Normalization
Q4 2025 includes approximately two months of program activity. When normalized to a full three-month quarter:
- Adjusted Q4 2025 Load: 263,457,431 kWh
This places the quarter within the mid-range of prior observed values rather than at the lower end.
Adjusted Q4 2025 load is an estimate calculated by annualizing reported partial-quarter activity. It is provided for analytical comparison only; actual reported load for Q4 2025 is 175,638,287 kWh.
Customer Participation Trends
Customer participation remained relatively stable through 2024, with peak enrollment occurring in Q2 2024 at 144,236 accounts.
A sharp contraction occurred between Q4 2024 and Q1 2025:
- Q4 2024: 143,107
- Q1 2025: 122,934
This represents a decline of more than 20,000 accounts in a single quarter.
By the end of 2025, total participation had declined to 117,726 customers:
- Peak to end decline: 144,236 → 117,726
- Net loss: 26,510 customers (~18.4%)
This pattern indicates a structural reduction in participation rather than gradual attrition.
Load Trends
Quarterly load varied due to seasonal and weather-driven demand, ranging from a high of 333.5 million kWh in Q3 2023 to a low of 170.8 million kWh in Q2 2025.
These fluctuations reflect both normal seasonal variation and changes in program participation.
Despite the decline in customer participation, total load remained comparatively resilient:
- Even at its lowest observed level, quarterly load exceeded 170 million kWh
- Normalized Q4 2025 load suggests continued mid-range demand at program end
Divergence Between Customers and Load
The data show a clear divergence between declining participation and relatively stable load:
- Customer participation declined by approximately 18% from peak levels
- Load declined less sharply and remained within historical ranges when adjusted for seasonality
This indicates that the program continued to serve a substantial share of electricity demand even as the number of participating accounts decreased.
Municipal Participation Context
Municipal participation declined prior to the end of the final contract cycle, with several communities exiting the program before expiration. The number of participating municipalities fell to 26 by 2025.
Municipal withdrawals provide critical context for the program’s declining participation.
Notable developments include:
- Mount Kisco, the location of Sustainable Westchester’s headquarters, did not continue participation through the final contract cycle
- Lewisboro, where Program Director Dan Welsh serves as a town council member, also exited prior to contract expiration; the town council voted 3–1 not to renew, with Welsh abstaining due to a conflict of interest
- Somers and other municipalities similarly opted not to renew participation
These departures were not isolated but occurred across multiple municipalities, indicating broader erosion in institutional support for the program.
Conclusion
The final three years of Westchester Power show a clear pattern:
- Stable participation through 2024, followed by a sharp contraction in 2025
- A significant reduction in participating customers, particularly at the start of the final contract year
- Continued delivery of substantial electricity load despite declining enrollment
Taken together, the data indicate that Westchester Power’s decline was driven primarily by falling participation and municipal withdrawals, rather than any collapse in underlying electricity demand — suggesting structural challenges in program design, governance, or value proposition.
This report was prepared with the assistance of AI tools under the direction and editing of Robert Cox.