

NEW YORK, NY — Prices in the New York-Northern New Jersey-Long Island area, as measured by the Consumer Price Index for All Urban Consumers (CPI-U), edged down 0.2 percent in October after advancing 0.5 percent in September, the U.S. Bureau of Labor Statistics reported today. Chief Regional Economist Martin Kohli attributed the downturn to lower energy prices. (Data in this report are not seasonally adjusted. Accordingly, month-to-month changes may reflect the impact of seasonal influences.)
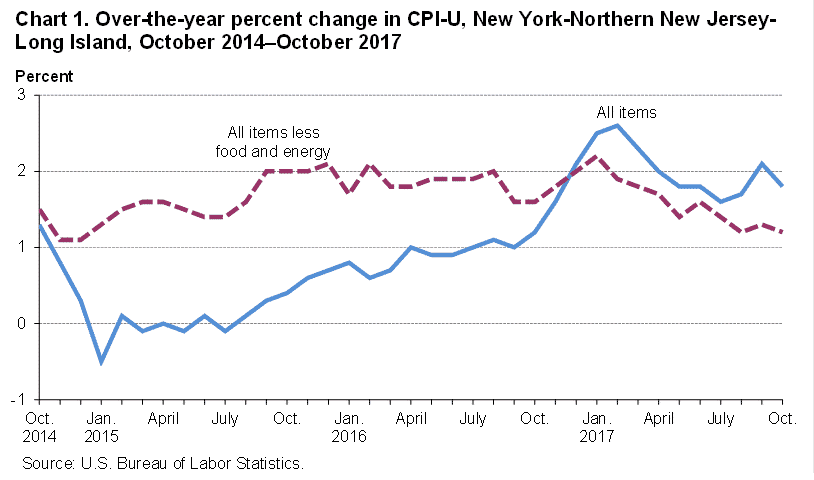
Over the year, the CPI-U rose 1.8 percent. The index for all items less food and energy increased 1.2 percent. (See table A and chart 1.) Price increases for shelter drove the 12-month change in both indexes. (See table 1.)
Food
The food index increased 0.4 percent after inching up 0.1 percent in September. At-home food prices advanced 0.5 percent, with cheese and sugar and artificial sweeteners among the groceries recording price increases. Away-from-home food prices rose 0.3 percent.
From October 2016 to October 2017, the food index increased 2.1 percent. Prices rose 2.1 percent for food at home, and for food away home, 2.2 percent.
Energy
The energy index fell 5.0 percent after jumping 5.7 percent in September. The decline, the largest since January 2015, was partly attributable to a 6.6-percent drop in gasoline prices, which had climbed 12.8 percent one month earlier. Household energy prices (-3.8 percent) also experienced a downturn in October, primarily due to a seasonal decline in energy services—prices for electricity decreased 6.5 percent, and prices for natural gas declined -0.5 percent.
Over the year, energy prices increased 10.1 percent, with gasoline prices rising 18.5 percent. A 4.7- percent rise in household energy prices included an 11.3-percent advance in natural gas charges, along with a 0.5-percent increase in electricity prices.
Allitemslessfoodandenergy
The index for all items less food and energy ticked up 0.1 percent, after edging up 0.2 percent in September. Shelter prices inched up 0.1 percent. Within shelter, residential rent increased 0.2 percent.
Higher prices were reported for medical care (0.7 percent), household furnishings and operations (0.7 percent), and airline fares. These increases were largely offset by lower prices for apparel and recreation.
For the year ended October 2017, the index for all items less food and energy increased 1.2 percent. Shelter prices increased 2.1 percent, with residential rent up 2.5 percent. Prices for medical care and for other goods and services each rose 1.9 percent, and prices for recreation increased 1.3 percent.
Table A. New York-Northern New Jersey-Long Island CPI-U 1-month and 12-month percent changes (not seasonally adjusted)
| Month | 2012 | 2013 | 2014 | 2015 | 2016 | 2017 | |||||||
| 1-month | 12-month | 1-month | 12-month | 1-month | 12-month | 1-month | 12-month | 1-month | 12-month | 1-month | 12-month | ||
| January | 0.4 | 2.8 | 0.5 | 2.2 | 0.9 | 1.9 | 0.1 | -0.5 | 0.2 | 0.8 | 0.6 | 2.5 | |
| February | 0.4 | 2.6 | 0.6 | 2.4 | -0.2 | 1.1 | 0.3 | 0.1 | 0.2 | 0.6 | 0.3 | 2.6 | |
| March | 0.6 | 2.6 | 0.1 | 1.9 | 0.4 | 1.3 | 0.2 | -0.1 | 0.2 | 0.7 | 0 | 2.3 | |
| April | 0.2 | 2.4 | -0.2 | 1.4 | 0 | 1.6 | 0.1 | 0 | 0.4 | 1 | 0.1 | 2 | |
| May | 0.1 | 1.8 | 0.1 | 1.4 | 0.5 | 1.9 | 0.4 | -0.1 | 0.3 | 0.9 | 0.1 | 1.8 | |
| June | -0.1 | 1.6 | 0.3 | 1.8 | 0 | 1.7 | 0.2 | 0.1 | 0.2(R) | 0.9(R) | 0.2 | 1.8 | |
| July | -0.2 | 1.1 | 0.2 | 2.1 | 0.1 | 1.6 | -0.1 | -0.1 | -0.1 | 1 | -0.2 | 1.6 | |
| August | 0.6 | 1.4 | 0.1 | 1.7 | -0.2 | 1.3 | 0.1 | 0.1 | 0.2 | 1.1 | 0.2 | 1.7 | |
| September | 0.4 | 1.6 | 0.3 | 1.6 | 0 | 1 | 0.2 | 0.3 | 0.2 | 1 | 0.5 | 2.1 | |
| October | -0.1 | 1.7 | -0.6 | 1.1 | -0.2 | 1.3 | -0.1 | 0.4 | 0.1 | 1.2 | -0.2 | 1.8 | |
| November | 0 | 2 | 0.1 | 1.2 | -0.4 | 0.8 | -0.2 | 0.6 | 0.2 | 1.6 | |||
| December | -0.3 | 2.1 | 0 | 1.5 | -0.5 | 0.3 | -0.4 | 0.7 | 0.1 | 2.1 | |||
| (R) = revised | |||||||||||||
CPI‐W
In October, the Consumer Price Index for Urban Wage Earners and Clerical Workers (CPI-W) was 264.578, down 0.3 percent over the month. The CPI-W rose 2.2 percent over the year.
The November 2017 Consumer Price Index for New York-Northern New Jersey-Long Island is scheduled to be released Wednesday, December 13, 2017, at 8:30 a.m. (ET).
Technical Note
The Consumer Price Index (CPI) is a measure of the average change in prices over time in a fixed market basket of goods and services. The Bureau of Labor Statistics publishes CPIs for two population groups: (1) a CPI for All Urban Consumers (CPI-U) which covers approximately 89 percent of the total population and (2) a CPI for Urban Wage Earners and Clerical Workers (CPI-W) which covers approximately 28 percent of the total population. The CPI-U includes, in addition to wage earners and clerical workers, groups such as professional, managerial, and technical workers, the self-employed, short-term workers, the unemployed, and retirees and others not in the labor force.
The CPI is based on prices of food, clothing, shelter, and fuels, transportation fares, charges for doctors’ and dentists’ services, drugs, and the other goods and services that people buy for day-to-day living. Each month, prices are collected in 87 urban areas across the country from about 6,000 housing units and approximately 24,000 retail establishments–department stores, supermarkets, hospitals, filling stations, and other types of stores and service establishments. All taxes directly associated with the purchase and use of items are included in the index.
The index measures price changes from a designated reference date (1982-84) that equals 100.0. An increase of 16.5 percent, for example, is shown as 116.5. This change can also be expressed in dollars as follows: the price of a base period “market basket” of goods and services in the CPI has risen from $10 in 1982-84 to $11.65. For further details see the CPI home page on the Internet at www.bls.gov/cpi and the BLS Handbook of Methods, Chapter 17, The Consumer Price Index, available on the Internet at www.bls.gov/opub/hom/pdf/homch17.pdf.
In calculating the index, price changes for the various items in each location are averaged together with weights that represent their importance in the spending of the appropriate population group. Local data are then combined to obtain a U.S. city average. Because the sample size of a local area is smaller, the local area index is subject to substantially more sampling and other measurement error than the national index. In addition, local indexes are not adjusted for seasonal influences. As a result, local area indexes show greater volatility than the national index, although their long-term trends are quite similar. NOTE: Area indexes do not measure differences in the level of prices between cities; they only measure the average change in prices for each area since the base period.
The New York-Northern New Jersey-Long Island, N.Y.-N.J.-Conn.-Pa. consolidated area covered in this release is comprised of Bronx, Dutchess, Kings, Nassau, New York, Orange, Putnam, Queens, Richmond, Rockland, Suffolk, and Westchester Counties in New York State; Bergen, Essex, Hudson, Hunterdon, Mercer, Middlesex, Monmouth, Morris, Ocean, Passaic, Somerset, Sussex, Union, and Warren Counties in New Jersey; Fairfield County and parts of Litchfield, Middlesex, and New Haven Counties in Connecticut; and Pike County in Pennsylvania.
Information in this release will be made available to sensory impaired individuals upon request. Voice phone: (202) 691-5200; Federal Relay Service: (800) 877-8339
Table 1. Consumer Price Index for All Urban Consumers (CPI-U): Indexes and percent changes for selected periods
New York-Northern N.J.-Long Island, NY-NJ-CT-PA (1982-84=100 unless otherwise noted)
| Item and Group | Indexes | Percent change from — | |||||
| Aug. 2017 | Sep. 2017 | Oct. 2017 | Oct. 2016 | Aug. 2017 | Sep. 2017 | ||
| Expenditure category | |||||||
| All items ………………………………………………………………………….. | 268.657 | 270.059 | 269.575 | 1.8 | 0.3 | -0.2 | |
| All items (1967=100) ………………………………………………………… | 776.65 | 780.704 | 779.305 | – | – | – | |
| Food and beverages ………………………………………………………. | 260.948 | 261.175 | 262.271 | 2 | 0.5 | 0.4 | |
| Food …………………………………………………………………………… | 261.084 | 261.243 | 262.309 | 2.1 | 0.5 | 0.4 | |
| Food at home …………………………………………………………….. | 252.606 | 252.197 | 253.405 | 2.1 | 0.3 | 0.5 | |
| Food away from home …………………………………………………. | 280.119 | 281.109 | 281.995 | 2.2 | 0.7 | 0.3 | |
| Alcoholic beverages ……………………………………………………… | 254.669 | 255.792 | 257.289 | 0.8 | 1 | 0.6 | |
| Housing ………………………………………………………………………… | 292.898 | 292.867 | 292.432 | 2.1 | -0.2 | -0.1 | |
| Shelter ………………………………………………………………………… | 370.744 | 370.662 | 371.091 | 2.1 | 0.1 | 0.1 | |
| Rent of primary residence 1 …………………………………………. | 383.15 | 383.268 | 384.111 | 2.5 | 0.3 | 0.2 | |
| Owners’ equivalent rent of residences 1 2 ……………………… | 376.331 | 376.922 | 377.79 | 2.1 | 0.4 | 0.2 | |
| Owners’ equivalent rent of primary residence 1 2 ………….. | 375.867 | 376.459 | 377.324 | 2.1 | 0.4 | 0.2 | |
| Fuels and utilities ………………………………………………………….. | 189.107 | 190.718 | 184.521 | 4.3 | -2.4 | -3.2 | |
| Household energy ………………………………………………………. | 181.001 | 182.804 | 175.806 | 4.7 | -2.9 | -3.8 | |
| Energy services 1 ……………………………………………………… | 175.878 | 176.6 | 168.407 | 3.8 | -4.2 | -4.6 | |
| Electricity 1 …………………………………………………………….. | 185.424 | 186.545 | 174.35 | 0.5 | -6 | -6.5 | |
| Utility (piped) gas service 1 ………………………………………. | 149.533 | 149.52 | 148.749 | 11.3 | -0.5 | -0.5 | |
| Household furnishings and operations …………………………….. | 109.195 | 108.094 | 108.872 | -0.9 | -0.3 | 0.7 | |
| Apparel …………………………………………………………………………. | 128.373 | 132.011 | 130.854 | 0.1 | 1.9 | -0.9 | |
| Transportation ……………………………………………………………….. | 211.533 | 217.462 | 215.299 | 3.2 | 1.8 | -1 | |
| Private transportation ……………………………………………………. | 199.166 | 204.868 | 201.485 | 3.7 | 1.2 | -1.7 | |
| Motor fuel ………………………………………………………………….. | 199.087 | 224.555 | 209.807 | 18.5 | 5.4 | -6.6 | |
| Gasoline (all types) ……………………………………………………. | 198.243 | 223.701 | 208.899 | 18.5 | 5.4 | -6.6 | |
| Gasoline, unleaded regular 3 ……………………………………. | 197.11 | 223.226 | 207.635 | 19.2 | 5.3 | -7 | |
| Gasoline, unleaded midgrade 3 4 ………………………………. | 206.501 | 228.957 | 218.182 | 15.3 | 5.7 | -4.7 | |
| Gasoline, unleaded premium 3 ………………………………….. | 208.204 | 229.001 | 219.685 | 14.2 | 5.5 | -4.1 | |
| Medical care ………………………………………………………………….. | 476.319 | 476.539 | 479.874 | 1.9 | 0.7 | 0.7 | |
| Recreation 5 ………………………………………………………………….. | 123.381 | 123.685 | 121.66 | 1.3 | -1.4 | -1.6 | |
| Education and communication 5 ………………………………………. | 141.397 | 142.094 | 142.227 | -0.7 | 0.6 | 0.1 | |
| Other goods and services ……………………………………………….. | 420.29 | 422.606 | 424.127 | 1.9 | 0.9 | 0.4 | |
| Commodity and service group | |||||||
| All items ………………………………………………………………………….. | 268.657 | 270.059 | 269.575 | 1.8 | 0.3 | -0.2 | |
|
|
|
|
|
|
|
|
|
|
|
|
|
|
|
|
|
|
|
|
|
|
|
|
|
93.246 | 92.697 | 92.819 | -2.3 | -0.5 | 0.1 | |
| Services ………………………………………………………………………… | 337.573 | 338.253 | 337.945 | 1.9 | 0.1 | -0.1 | |
| Special aggregate indexes | |||||||
| All items less medical care ………………………………………………… | 259.633 | 261.083 | 260.441 | 1.8 | 0.3 | -0.2 | |
| All items less shelter …………………………………………………………. | 228.207 | 230.219 | 229.361 | 1.7 | 0.5 | -0.4 | |
| Commodities less food ……………………………………………………… | 146.474 | 149.693 | 148.244 | 1.4 | 1.2 | -1 | |
| Nondurables ……………………………………………………………………. | 222.47 | 226.274 | 225.138 | 2.7 | 1.2 | -0.5 | |
| Nondurables less food ………………………………………………………. | 185.451 | 192.012 | 189.177 | 3.2 | 2 | -1.5 | |
| Services less rent of shelter 2 …………………………………………… | 312.425 | 313.95 | 312.833 | 1.6 | 0.1 | -0.4 | |
| Services less medical care services ……………………………………. | 326.062 | 326.694 | 326.174 | 1.7 | 0 | -0.2 | |
| Energy ……………………………………………………………………………. | 190.395 | 201.202 | 191.166 | 10.1 | 0.4 | -5 | |
| All items less energy ………………………………………………………… | 278.132 | 278.666 | 279.072 | 1.3 | 0.3 | 0.1 | |
|
282.983 | 283.583 | 283.881 | 1.2 | 0.3 | 0.1 | |
This index series was calculated using a Laspeyres estimator. All other item stratum index series were calculated using a geometric means
estimator. 2 Index is on a December 1982=100 base. 3 Special index based on a substantially smaller sample. 4 Indexes on a December 1993=100 base. 5 Indexes on a December 1997=100 base. – Data not available.
NOTE: Index applies to a month as a whole, not to any specific date.